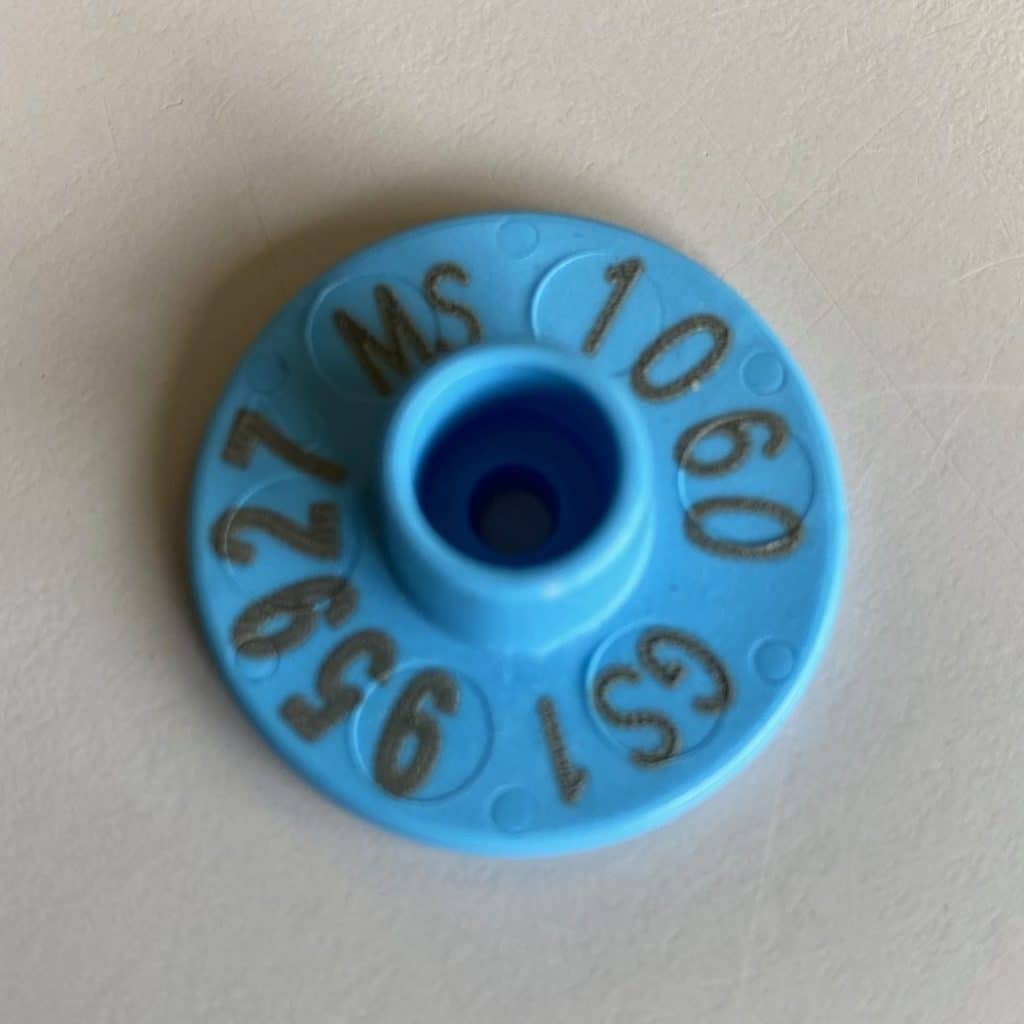
Photo electronic earmark
"More efficient pig farm management through individual monitoring of sows and fattening pigs"
The aim of the PigID project is better management of the pig farm by identifying opportunities through traceability of various data from birth to slaughter. This through the placement of electronic ear tags (transponders).
Current situation
Today's pig farmer needs insights into how to track individual pigs, what data to collect and see what the added value of that is. For example, a sow farmer currently selects sows and boars based on fertility and farrowing-house parameters, but cannot easily assess growth and offspring quality. Individual animal monitoring of piglets and fattening pigs, however, makes this possible.
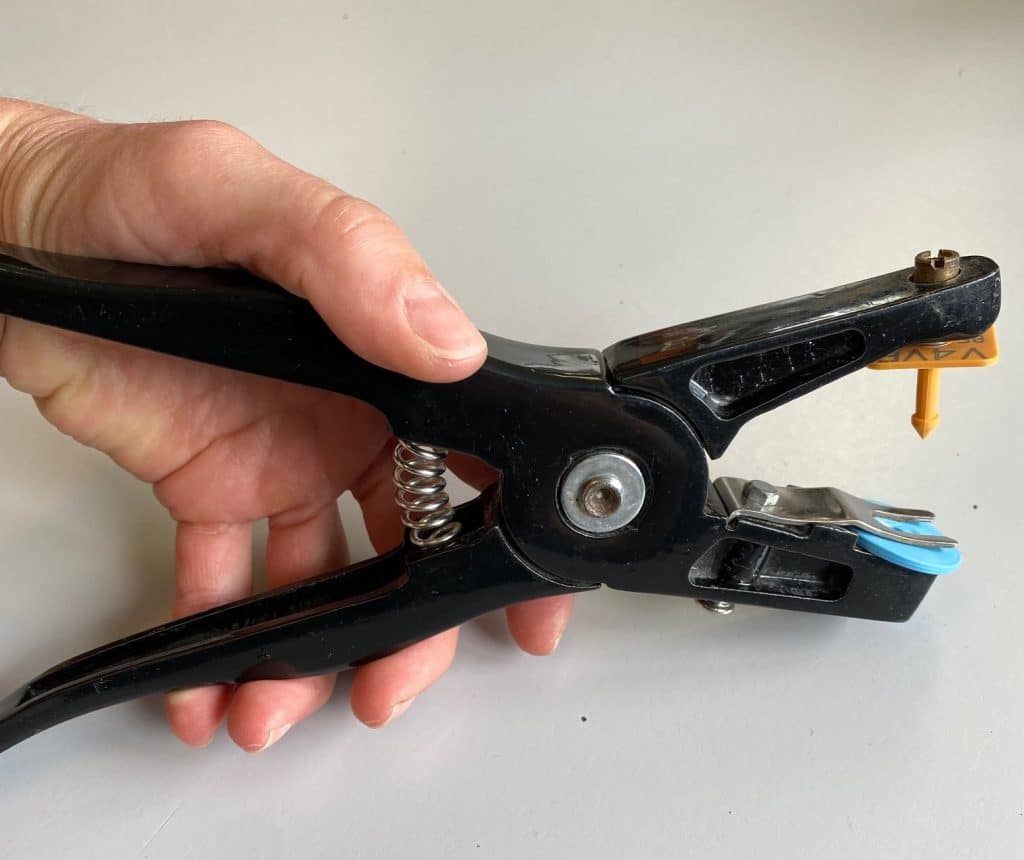
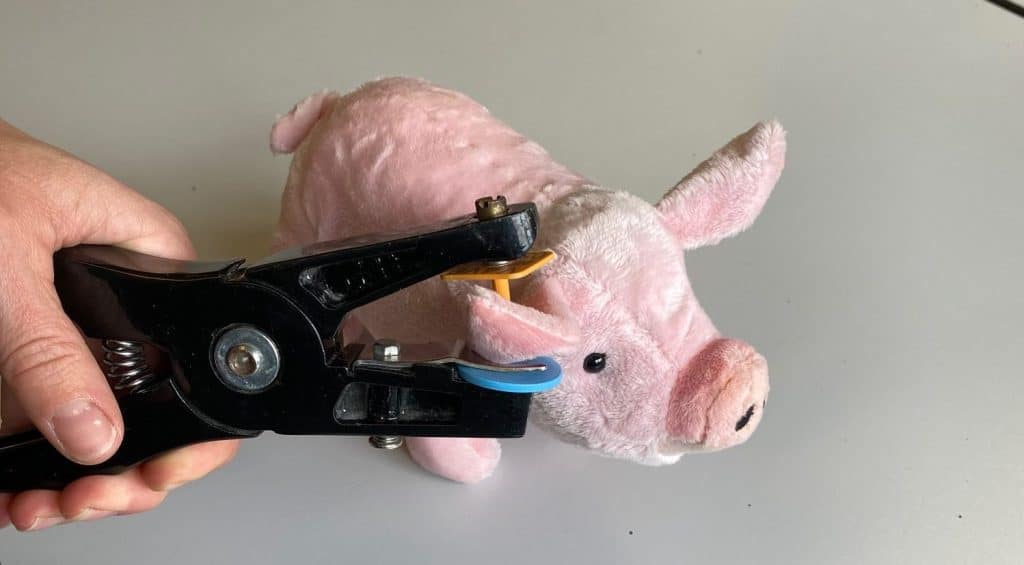
Photo pliers ear numbers
How does it work?
Once the piglets are marked with electronic ear tags (Ultra High Frequency), we can read out each piglet individually using an ear tag reader. PigID works with two different programmes to capture and process all the information from the pigs, namely PigExpert from Agrisyst and LeeO.
PigExpert uses an android smartphone with a built-in scanner.
LeeO also uses an android smartphone and the scanner is a separate device. You can place this scanner on a selfie stick, for example, to make it easier to reach pigs in a group.
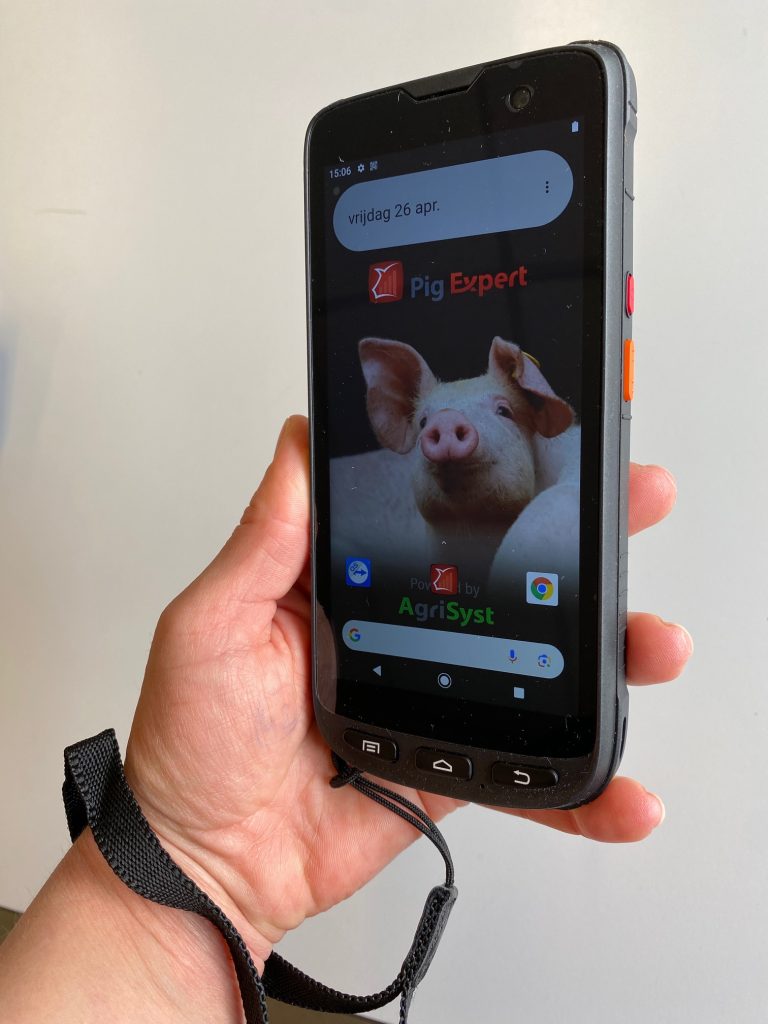
Photo pigexpert reader
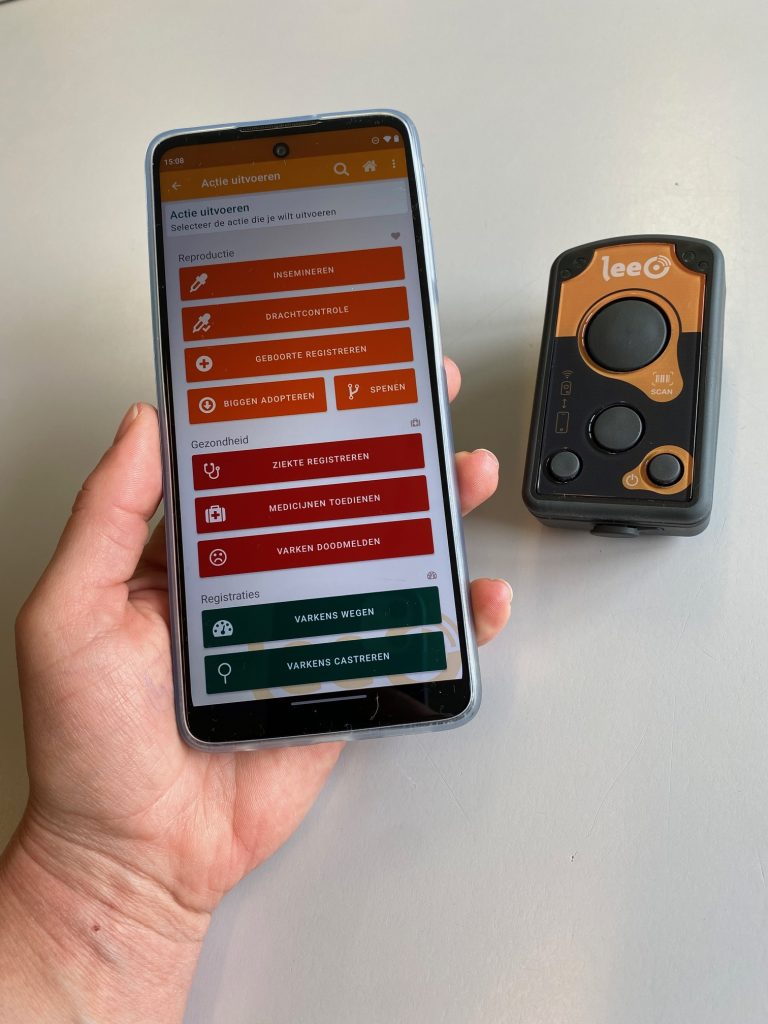
Photo LeeO reader
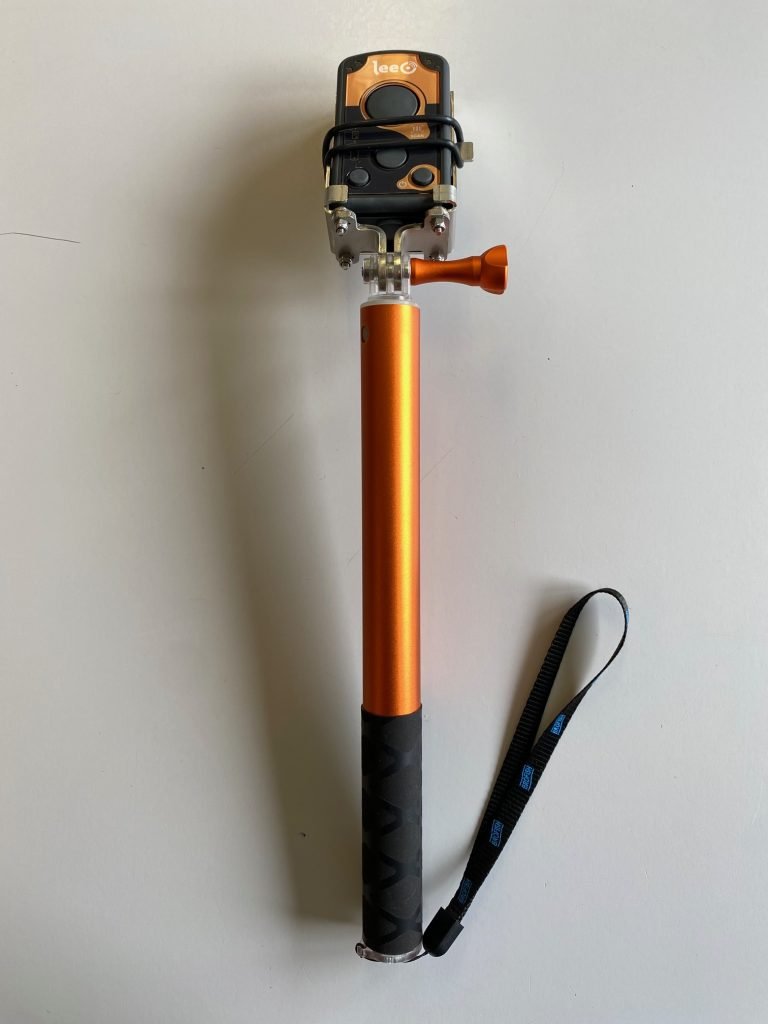
Photo selfie stick with LeeO scanner
Among other things, what can be registered?
Birth date, genetics, sex, weight, weaning date, litter data, type of feed, medication, vaccination, causes of death, slaughter data ... Anything that seems useful can be recorded.
Examples of key figures that can be examined
- Impact of sow/boar on offspring growth performance?
- Carcass performance of offspring at sow/bear level?
- Number of kilos of pigs delivered per sow per year
- Number of euros yielded per sow per year?
- Average slaughter age of offspring of each sow/bear
- Number of failed pigs? Reason for failure?
- Medication use
In conclusion
The results of the key figures assessed are visualised on a dashboard using graphs.
To convert the data into useful information, a benchmarking system will be set up to allow comparison within the same company and between companies. Finally, the experiences and results will be widely communicated to the industry.
Are you a pig farmer and would you like to contribute to this research? Or would you like to be informed about news, events and results in the context of PigID?
Would you like to keep up to date with our surveys? Then subscribe to our newsletter.


